Related
Compare Policy Estimate Scenarios
All Reinsurance Years
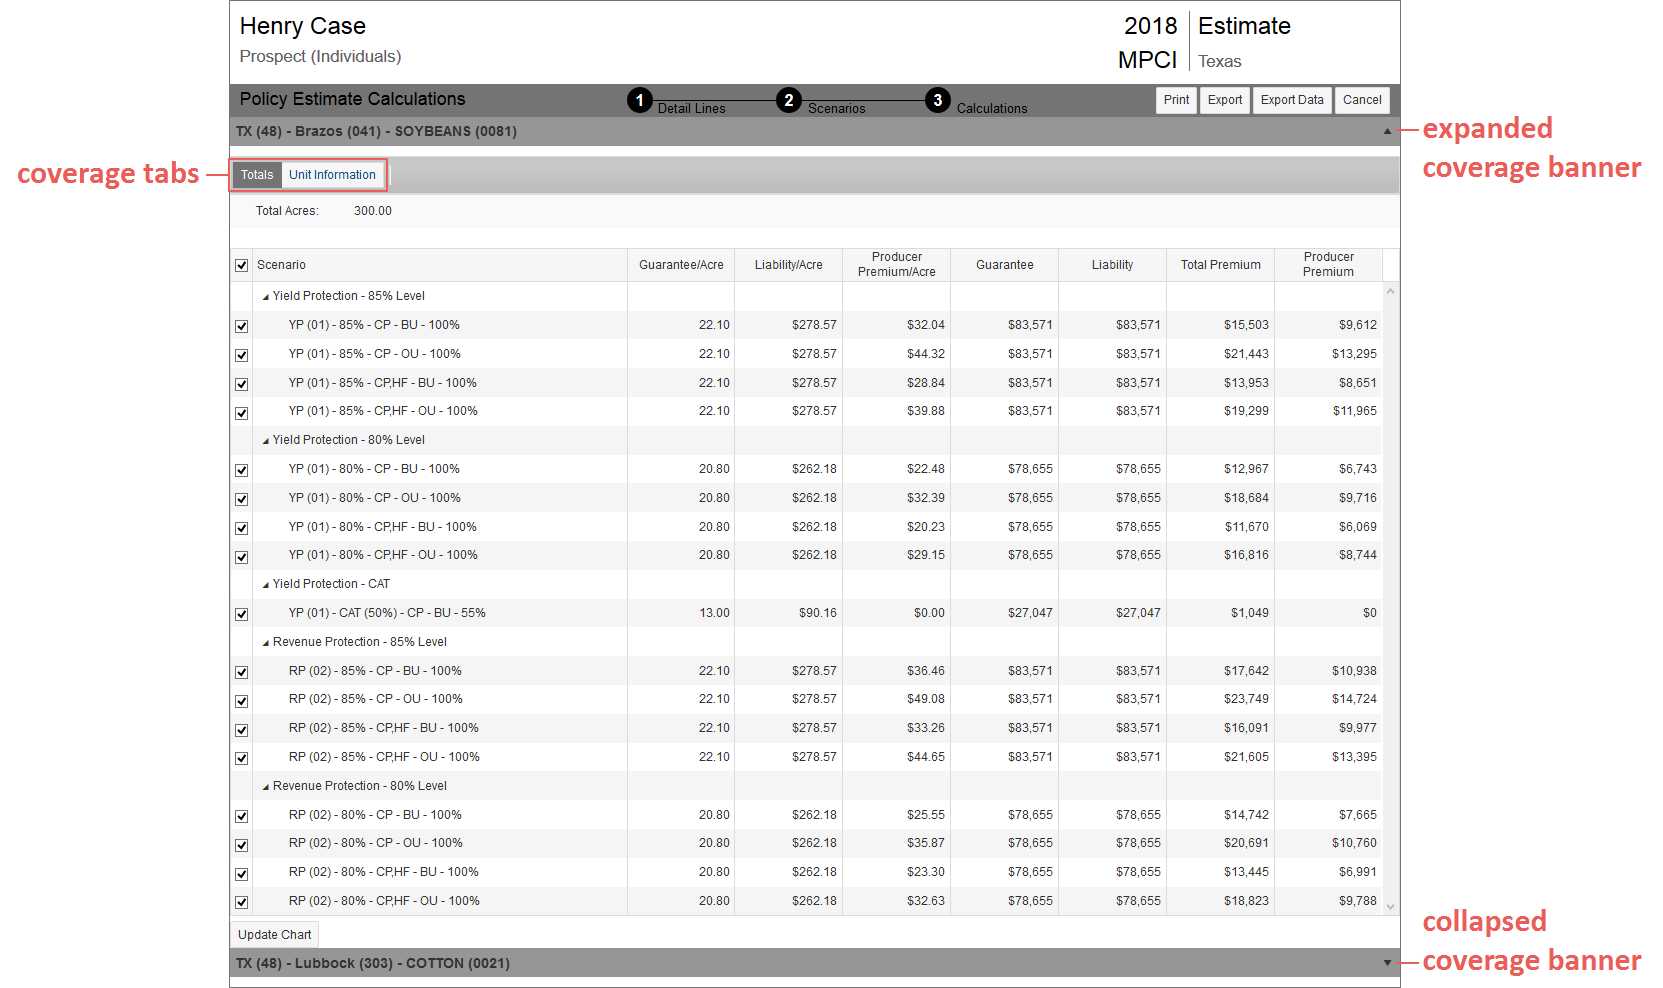
After you’ve built the estimate scenarios for the coverages you selected on the Policy Estimate Scenarios page and calculated them, they are available within expandable and collapsible coverage banners on the Policy Estimate Calculations page for comparison at the coverage and unit level using the Totals and Unit Information tabs in each coverage section.
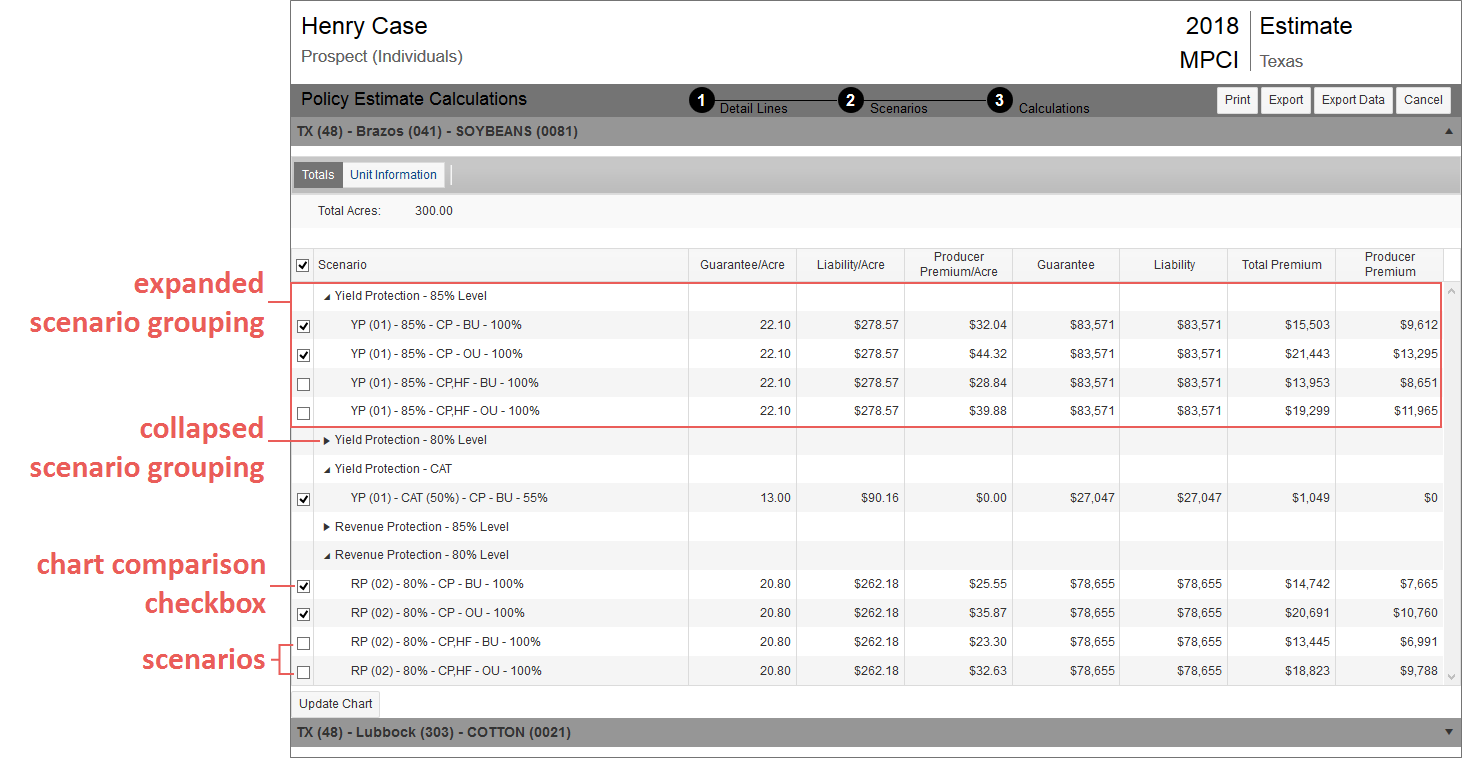
This tab shows the Total Acres from all units/detail lines within the estimate for the expanded coverage. The grid is divided into coverage scenario rows; each scenario is then divided into vertical columns that display the Guarantee/Acre, Liability/Acre, Producer Premium/Acre, Guarantee, Liability, Total Premium, and Producer Premium.
The Totals Scenario Grid
| • | Scenarios: By default, each scenario grouping is expanded to show each scenario for the selected Plans/Coverage Levels/Options/Price %s-Protection Factors. To collapse a scenario grouping, click the collapse button ( ) next to it. Each scenario lists these values: Guarantee/Acre, Liability/Acre, Producer Premium/Acre, Guarantee, Liability, Total Premium, and Producer Premium. ) next to it. Each scenario lists these values: Guarantee/Acre, Liability/Acre, Producer Premium/Acre, Guarantee, Liability, Total Premium, and Producer Premium. |
NOTE: The Producer Premium is calculated as Total Premium minus (-) Subsidy.
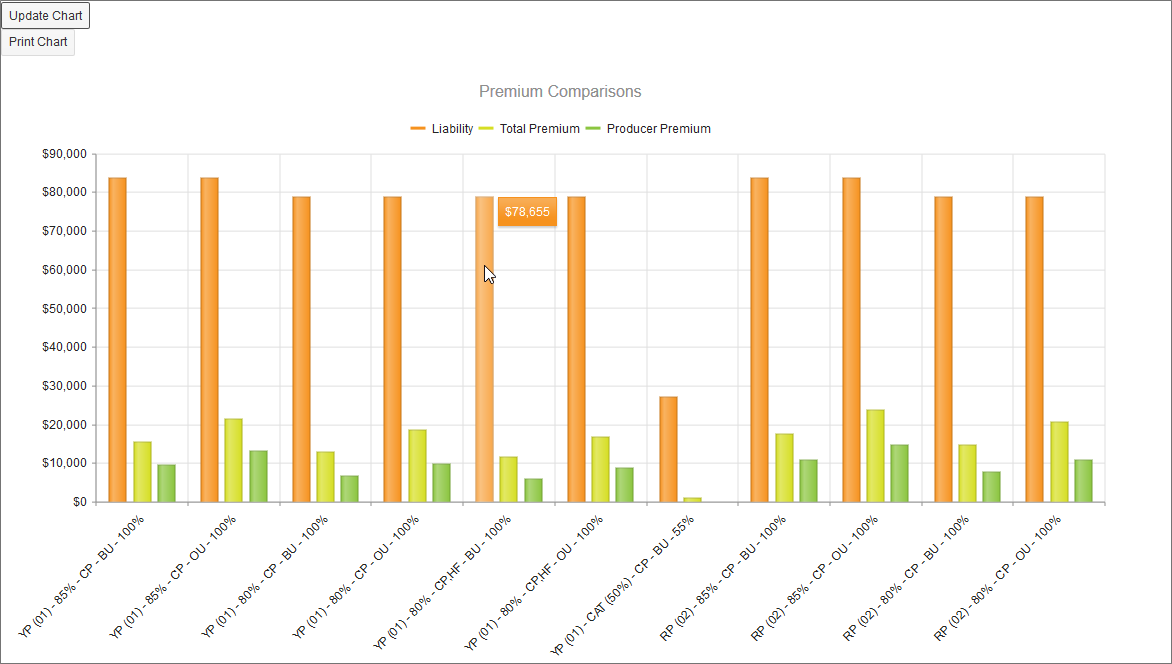
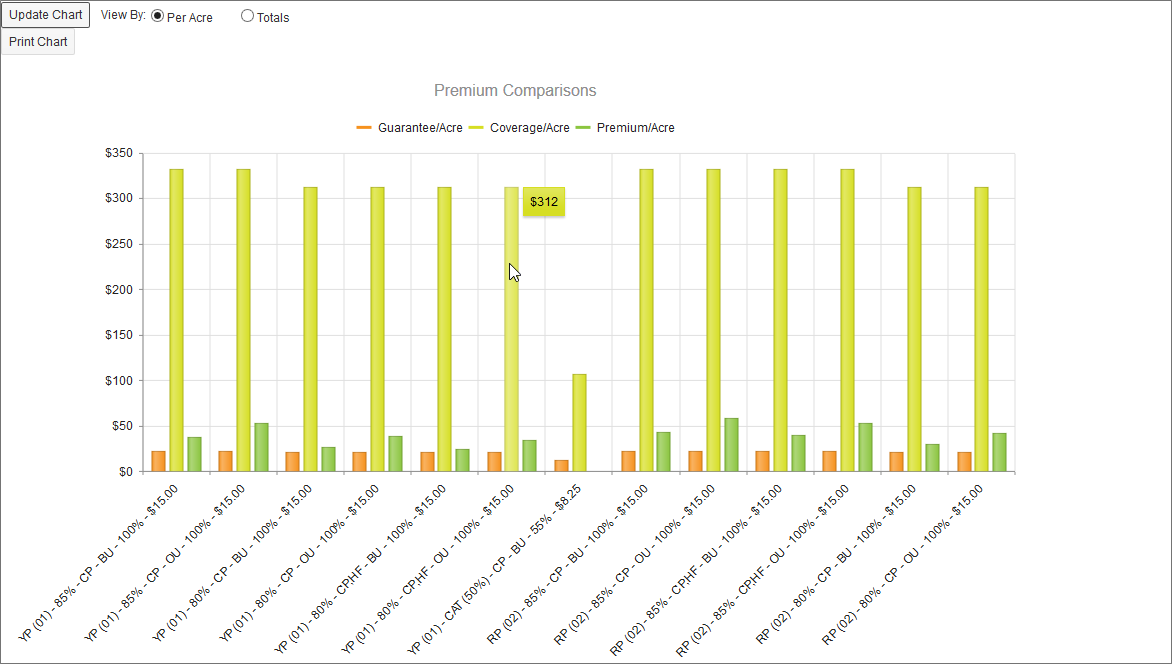
| • | Chart Comparison: For each estimate scenario, a checkbox is available to the left. Select this checkbox and click the Update Chart button (at the bottom of the grid) to view the Premium Comparisons chart for the selected scenarios. The Premium Comparisons chart displays below the Totals grid. You can also click Print Chart to open the chart in a new browser window to print it. |
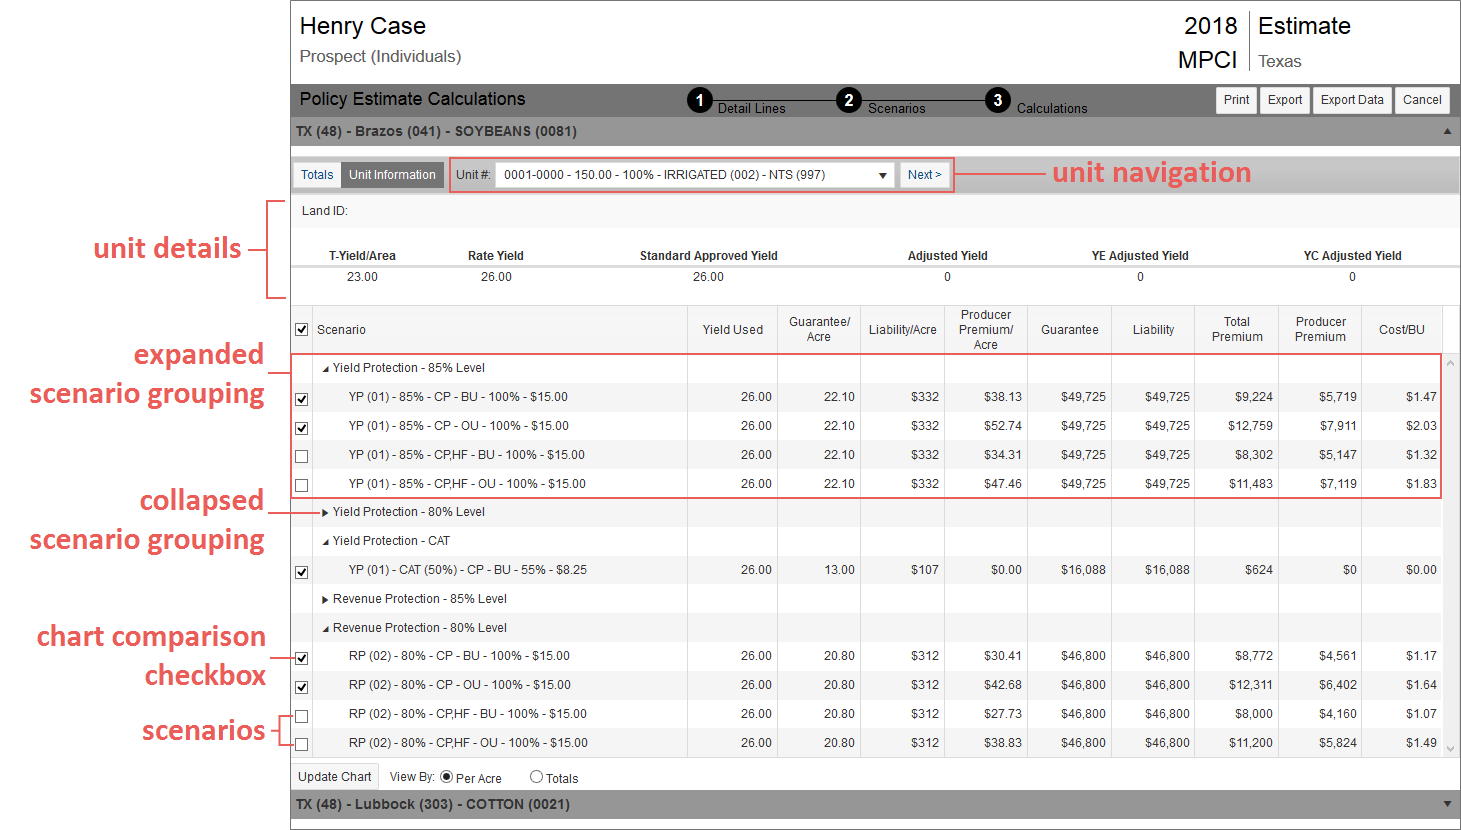
This tab allows the user to compare different units for each of the chosen coverage scenarios, with each scenario displaying the Yield Used, Guarantee/Acre, Liability/Acre, Producer Premium/Acre, Guarantee, Liability, Total Premium, Producer Premium, and Cost/UOM (the UOM—unit of measure—changes based on the commodity chosen). Units are displayed in sequential order (e.g., 0001-0001, 0001-0002, 0002-0001).
The Unit Information Header
| • | Unit Details: This area displays the Land ID (if available), T-Yield/Area, Rate Yield, Standard Approved Yield, Adjusted Yield, YE Adjusted Yield, and YC Adjusted Yield for the selected unit, and the unit information scenarios grid below the unit details area displays the scenarios and their respective values for the selected unit. |
NOTE: The State, County, and Crop information for the coverage the unit is on display in the expanded coverage banner header.
The Rate Yield displays the Rate Yield listed on the detail line; however, if the Rate Yield on the detail line is zero for an existing grower, the System will display the Rate Yield on the APH.
| • | Unit Navigation: To move through the units in a selected coverage, select a unit from the Unit # dropdown or click on the Previous and Next buttons. |
The Unit Information Scenarios Grid
| • | Scenarios: By default, each scenario grouping is expanded to show each scenario for the selected Plans/Coverage Levels/Options/Price %s-Protection Factors. To collapse a scenario grouping, click the collapse button ( ) next to it. Each scenario lists these values: Yield Used, Guarantee/Acre, Liability/Acre, Producer Premium/Acre, Guarantee, Liability, Total Premium, Producer Premium, and Cost/UOM (the UOM—unit of measure—changes based on the commodity chosen). ) next to it. Each scenario lists these values: Yield Used, Guarantee/Acre, Liability/Acre, Producer Premium/Acre, Guarantee, Liability, Total Premium, Producer Premium, and Cost/UOM (the UOM—unit of measure—changes based on the commodity chosen). |
NOTE: The Producer Premium is calculated as Total Premium minus (-) Subsidy.
| • | Chart Comparison: For each estimate scenario, a checkbox is available to the left. Select this checkbox and click the Update Chart button (at the bottom of the grid) to view the Premium Comparisons chart for the selected scenarios. The Premium Comparisons chart displays below the Unit Information Scenarios grid. You can toggle between "Per Acre" and "Totals" views. |
In the above example, the Premium Comparisons chart shows the Guarantee/Acre, Coverage/Acre, and Premium/Acre for each of the selected scenarios in the Unit Information Scenarios grid. To view the actual value for a bar, hover over the individual bar. You can choose to view premiums per acres or by total.
