|
1.
|
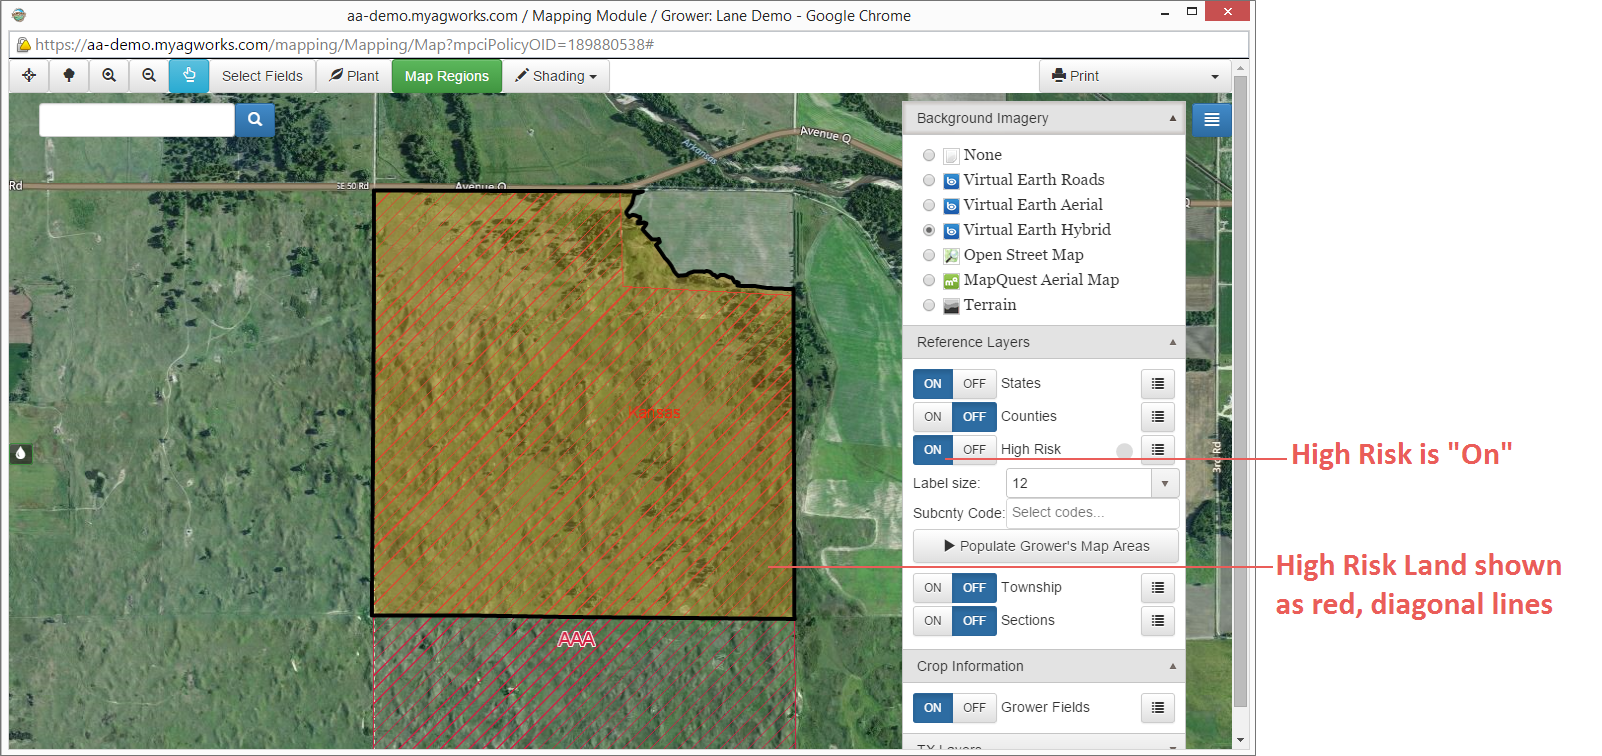
To view high risk land in the viewable area, open the Layers panel by clicking  in the Mapping window. The Layers panel opens. in the Mapping window. The Layers panel opens. |
|
2.
|
In the Reference Layers section of the Layers panel, click On in the High Risk field (the button should turn blue; if it was already blue, do nothing). The map refreshes and high risk land displays as red, diagonal lines as applicable to the State/County on the coverage. |
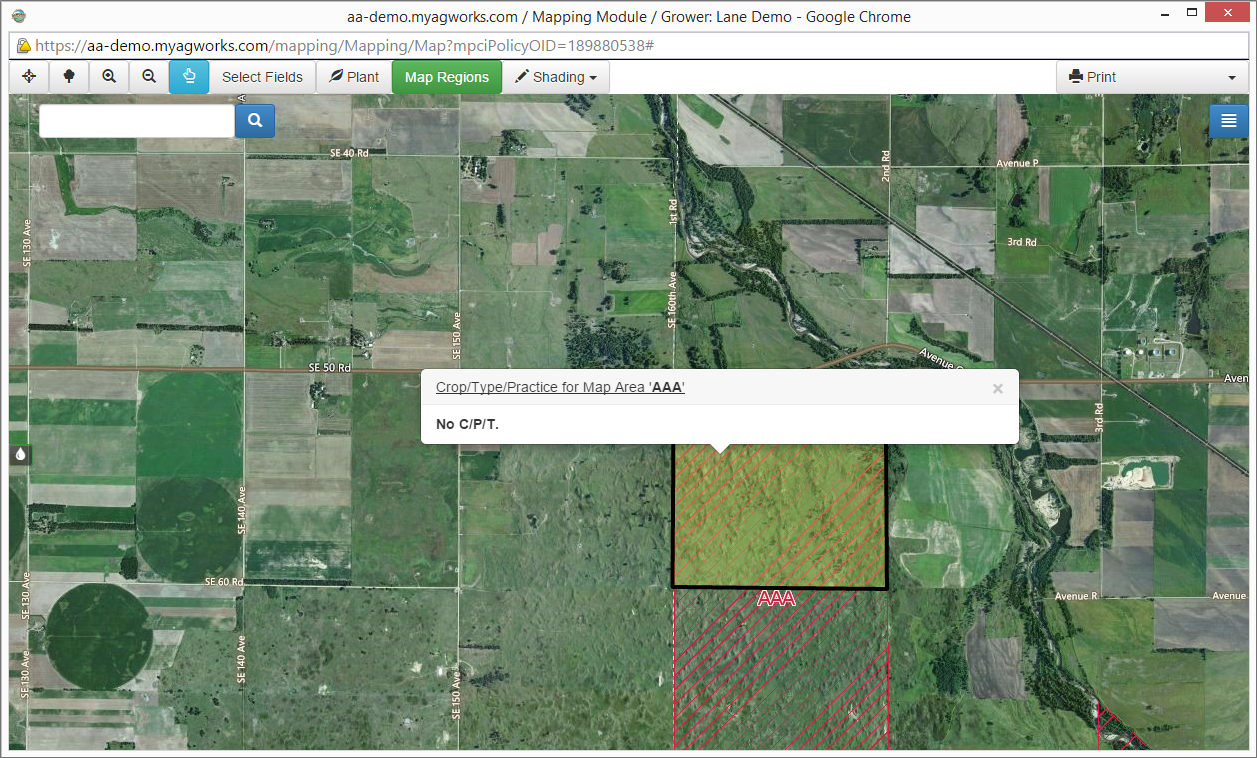
NOTE: To enable the HR/Map Area popup, select the round circle next to the High Risk menu icon. When selected (will change to green), you can click on any point on the map to view the High Risk/Map Area information.
|
3.
|
To customize the view of high risk land, click the menu ( ) button that corresponds with the High Risk field and perform any or all of the following: ) button that corresponds with the High Risk field and perform any or all of the following: |
|
•
|
Label size: From the dropdown, select the font size for the high risk label shown on the map (e.g., AAA, BBB). “12” is the default setting. |
|
•
|
Subcnty Code: To view only specific SubCounty Codes in the Mapping window, click in the SubCnty Code field. A dropdown displays. From the dropdown, select the code(s) you want to display on the map. Each selected code displays in the Subcnty Code field. To remove a selected code, click the X that corresponds with it. The SubCnty Code is removed from the field. |
|
•
|
Display Map Areas for All Crops To view only high risk land that is relevant to the fields associated with the policyholder, click this button. The System will display only the high risk land that overlaps with the policyholder’s fields. Then, when hovering over the High Risk land in the policyholder’s map area, if the popup is enabled (see the note in step 2), a user can see which Crops/Types/Practices can be planted in the area. |
|
•
|
Refresh Grower's Map Area: To insure that newly added Crops/Types/Practices display on the map, click this button. |

